
To test stability after tuning your PC, run a controlled stress test for CPU and GPU while logging temperatures, clocks, and power. The goal is repeatable, error-free workload behavior without thermal throttling, crashes, or performance drops. Use reliable monitoring software, start from a known baseline, change one setting at a time, and keep rollback options ready.
Pre-test Stability Checklist
- Save your current BIOS/UEFI profile (or note every changed value) so you can roll back quickly.
- Close nonessential background apps and overlays that can hook into sensors or rendering.
- Install and verify at least one temperature monitor: a ซอฟต์แวร์ตรวจสอบอุณหภูมิ CPU and a ซอฟต์แวร์ตรวจสอบอุณหภูมิ GPU.
- Confirm your cooling setup is "normal": fans respond to load and case airflow is not obstructed.
- Enable logging in your monitoring tool (CSV/log file) before you run any โปรแกรมทดสอบเสถียรภาพคอมพิวเตอร์.
- Plan your test order: baseline (stock) → CPU-only → GPU-only → combined load.
Preparing the System and Establishing Baselines
- Best fit: intermediate users who changed CPU/GPU clocks, undervolt/overvolt, memory tuning (XMP/EXPO), or fan curves and want a safe, repeatable validation process.
- Do not run stress tests if: you suspect a failing PSU, smell burning/electrical odor, see melted connectors/cables, have loose cooler mounting, or the system already crashes at idle.
Baseline setup checklist (reduce variables)
- Update GPU driver and chipset driver only if your system is currently stable (avoid stacking "new driver + new OC" in the same session).
- Check Windows Event Viewer (or your OS logs) for repeated hardware error entries before testing.
- Set a conservative fan curve temporarily (prioritize stability diagnostics over silence).
- Disable "auto-overclock" features you did not explicitly choose (to avoid hidden variables).
Baseline capture steps (before pushing load)
- Return to a known good profile (stock or your last stable profile) and boot normally.
- Idle for a few minutes, then record baseline readings: CPU package temperature, GPU hotspot (if available), clocks, and fan speeds.
- Run a short, low-risk workload (a game menu, a compile, a render preview) to confirm sensors and fans respond as expected.
- Only after the baseline looks normal, apply your new tuning change(s) and repeat the same baseline snapshot.
Selecting and Configuring Stress-test Tools
Tooling readiness checklist (before installing/running)
- Pick at least one dedicated โปรแกรม stress test CPU and one โปรแกรม stress test GPU; avoid mixing multiple heavy tools at the same time until you have single-component stability.
- Use one monitoring suite for logging (avoid running multiple sensor pollers that can conflict).
- Ensure you have admin rights to install drivers/services if your monitoring tool needs them.
- Confirm your system power plan is consistent (don't switch plans mid-test).
Recommended tool types (practical choices)
- CPU stress: Prime95 (Small FFTs / Blend), OCCT CPU test, y-cruncher.
- GPU stress: 3DMark Stress Test, Unigine Superposition loop, OCCT 3D test (as a โปรแกรม stress test GPU option).
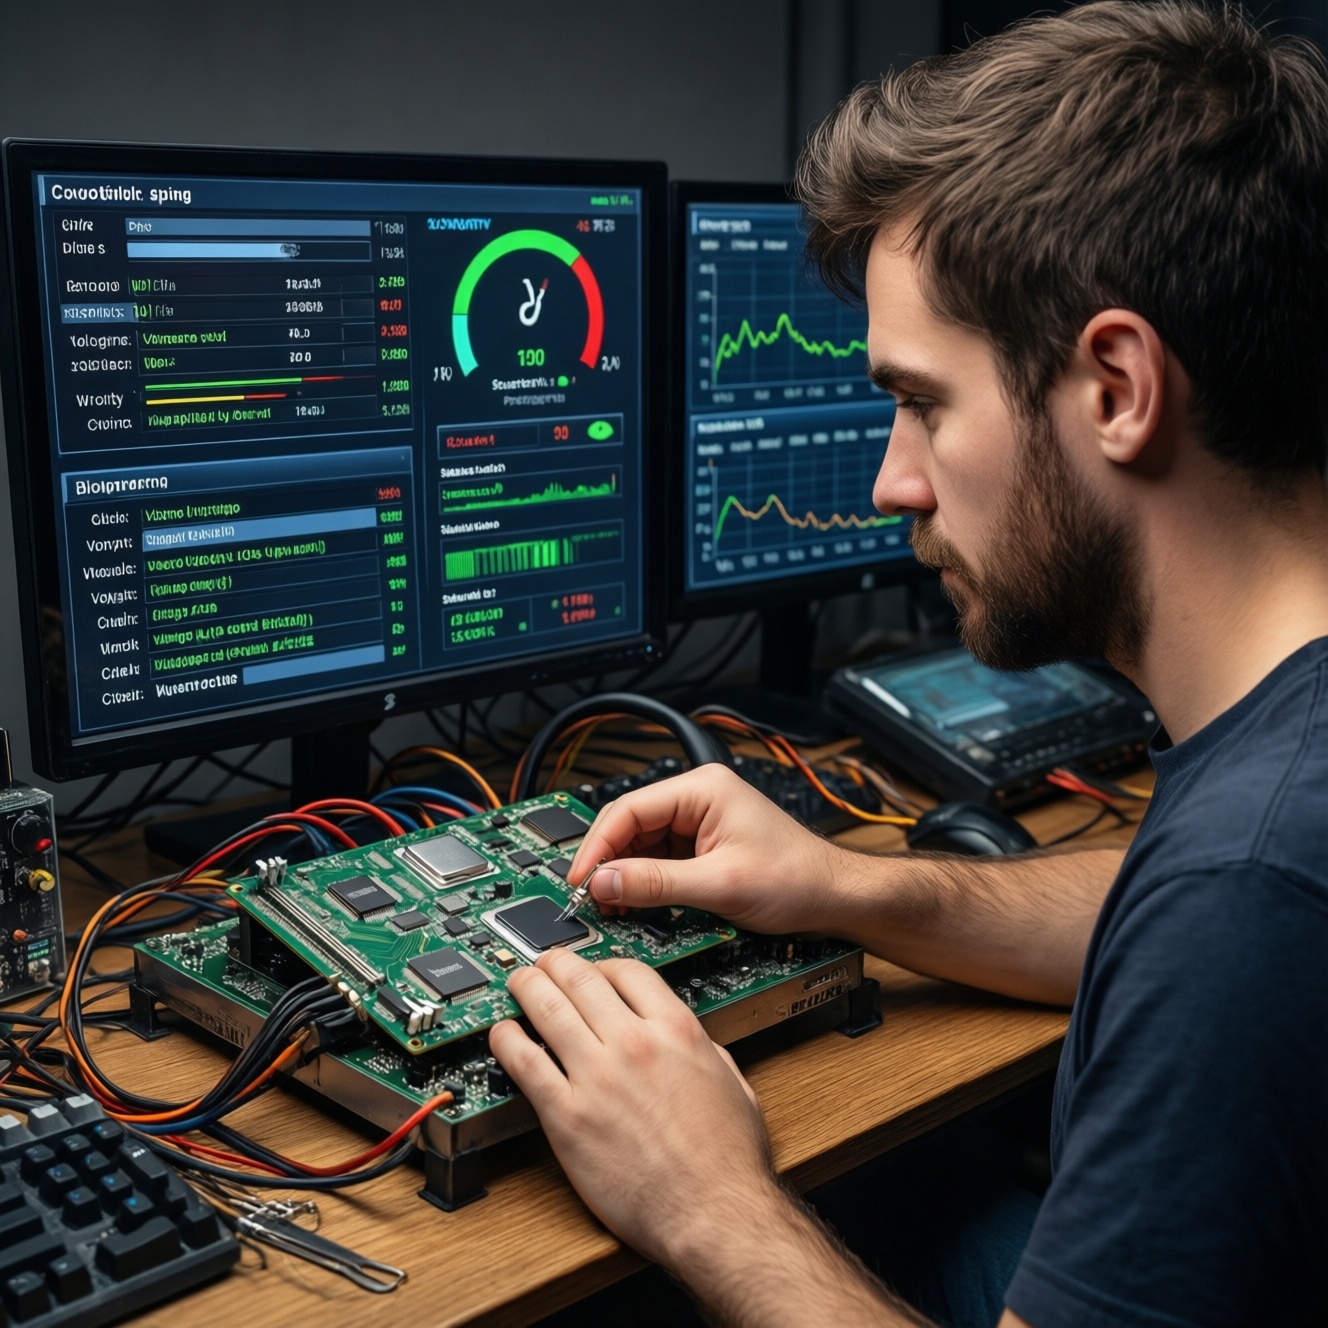
- Monitoring/logging: HWiNFO (sensors + logging), MSI Afterburner + RivaTuner (GPU-focused), GPU-Z (GPU sensors).
Configuration rules that reduce false conclusions

- Start "component-only" first: run CPU-only tests before combined loads so you can attribute the failure correctly.
- Use repeatable settings: fixed test mode, consistent window/fullscreen choice, and the same scene/loop each run.
- Log the right sensors: CPU package temp, per-core effective clocks (if available), GPU core clock, GPU hotspot, GPU memory clock, GPU power, and fan RPM/percent.
- Avoid stacking changes: one variable per round (e.g., only CPU undervolt, or only GPU curve), otherwise you won't know what caused instability.
Reading and Interpreting CPU/GPU Temperature Data
Mini prep checklist (before you press Start)
- Open your ซอฟต์แวร์ตรวจสอบอุณหภูมิ CPU and ซอฟต์แวร์ตรวจสอบอุณหภูมิ GPU and confirm readings change when you open/close a simple workload.
- Enable sensor logging to a file and note the exact test name and settings in a text note.
- Decide your stop conditions: any errors, any visible artifacts, sudden clock drops, or temperatures approaching platform limits.
- Keep a rollback plan open: BIOS profile slot, saved GPU tuning profile, or "Reset to defaults" path.
-
Choose the temperature sensors that actually matter
For CPU, prioritize "CPU Package" (or equivalent) over a single motherboard "CPU" label. For GPU, prioritize "GPU Hotspot/Junction" (if available) and "GPU Temperature," because throttling often follows hotspot behavior.
- If you only see one GPU temperature, use it consistently and compare runs rather than chasing absolute numbers.
- If your tool shows multiple CPU readings, log them all at first, then narrow down to the most responsive one.
-
Establish a baseline curve, not a single reading
Watch how fast temperatures rise and whether they plateau. A smooth rise then stable plateau suggests adequate cooling; a continuous climb suggests saturation (case airflow, paste, mounting pressure, or fan curve issues).
-
Correlate temperature with clocks and performance
Temperature alone is not the whole story. If temperature rises and clocks hold steady, you may be fine; if temperature rises and clocks drop (or frame rate dips), you're likely hitting thermal or power limits.
- CPU: compare "effective clock" (if available) versus "requested/boost clock."
- GPU: compare "core clock" against "power limit" and "voltage limit" indicators (if your tool exposes them).
-
Identify abnormal spikes and sensor polling issues
Single-sample spikes can be real (load transients) or a polling artifact. Confirm by checking whether the spike coincides with fan ramp, power spike, or a clock change; if nothing else changes, treat it cautiously and re-run for consistency.
-
Use "stop and cool" re-tests to separate heat from instability
If you crash only after the system heat-soaks, it may be thermal or VRM-related rather than a pure voltage/frequency problem. Let the system cool to idle, rerun the same test, and see if failure timing changes.
-
Decide what to change based on the pattern
If temperatures climb too aggressively, improve cooling or fan curve before pushing voltage. If temperatures are fine but errors occur quickly, back off frequency/undervolt and revalidate with the same tool and settings.
Monitoring Power, Voltages and Clock Behavior
- CPU clocks stay consistent under load (no repeating saw-tooth drops unless expected from your platform behavior).
- GPU clocks do not collapse mid-run without an obvious cause (alt-tab, overlay, driver reset, power-limit flag).
- No "WHEA" hardware error entries appear during/after CPU-heavy tests.
- System voltage behavior looks stable (no rapid oscillation that coincides with stutter or errors).
- GPU power draw and voltage correlate logically with your tuning (e.g., undervolt should generally reduce voltage at a given frequency).
- Fans ramp smoothly; no fan repeatedly stopping/starting under load.
- Frame pacing stays consistent in GPU loops (stutter combined with clock drops often indicates limiting).
- Combined load (CPU+GPU) does not trigger sudden shutdowns or black screens (often PSU/power delivery symptoms).
Detecting Thermal Throttling and Stability Symptoms
- Confusing "high temperature" with "throttling": throttling is typically visible as sustained clock drops and performance loss, not just a warm reading.
- Testing CPU and GPU together too early: you lose root cause. Validate each component first, then do combined loads last.
- Declaring stability after a single pass: repeat the same test with the same settings; instability can be intermittent or heat-soak dependent.
- Ignoring artifacts: flickers, sparkles, polygon glitches, or texture corruption usually mean GPU/VRAM instability even if it doesn't crash.
- Missing "silent" errors: a run can look fine but still log corrected hardware errors (e.g., WHEA). Treat those as instability signals.
- Overlay conflicts and capture tools: monitoring overlays can cause crashes or false positives in some GPU tests; if issues vanish with overlays off, retest clean.
- Over-tight undervolts: a GPU undervolt that is "almost stable" often fails at scene changes or transient spikes; add margin or reduce the target frequency.
- Thermal paste/mounting assumptions: if CPU temperature ramps unusually fast versus your previous baseline, reseat the cooler before chasing voltage.
Post-test Analysis: Logs, Reproducibility and Safe Tweaks
Log hygiene checklist (so comparisons stay valid)
- Save the log file with a clear name: date + change + tool + mode (so you can compare later).
- Write down: BIOS profile used, GPU profile used, ambient conditions that were unusual (closed case panel, dusty filter, hot room).
- Confirm the issue is reproducible with the same test and settings before changing anything.
Safe next moves (choose what fits the symptom)
- Cooling-first adjustment: if temperatures trend upward without stabilizing, improve airflow/fan curve, clean filters, or reseat cooling before increasing voltage or lowering limits.
- Back off one notch and re-run the same test: if you see errors, artifacts, driver resets, or WHEA entries, reduce frequency or relax undervolt slightly, then repeat the identical run to confirm the fix.
- Switch to a different workload class: if only one tool fails, cross-check with another โปรแกรมทดสอบเสถียรภาพคอมพิวเตอร์ (CPU: mixed vs FFT-heavy; GPU: synthetic loop vs real game benchmark loop) to avoid tool-specific edge cases.
- Validate with real usage: once synthetic tests look consistent, verify with your actual apps/games for a session; stability that matters is stability in your workload.
Common Clarifications and Quick Remedies
Which is better: a โปรแกรม stress test CPU or a real workload?
Use a CPU stress test to quickly expose voltage and cooling limits, then confirm with your real workload. Synthetic stability without real-world validation can still miss app-specific spikes.
Do I need a โปรแกรม stress test GPU if my issue is "only in games"?
Yes, because a dedicated GPU test makes the problem easier to reproduce and monitor. If it passes GPU-only but fails in games, investigate overlays, drivers, and combined CPU+GPU load.
Why do my temperatures look fine but I still crash?
Crashes can come from undervolt instability, transient spikes, memory/IMC instability, or power delivery issues. Check logs for WHEA entries and watch clocks/voltage behavior at the crash moment.
What should I watch first in ซอฟต์แวร์ตรวจสอบอุณหภูมิ CPU?
Start with CPU Package temperature plus effective clocks. If package temperature is stable but clocks drop repeatedly, you're likely limited by power/boost logic rather than raw heat.
What should I watch first in ซอฟต์แวร์ตรวจสอบอุณหภูมิ GPU?
Track GPU Hotspot/Junction (if available), core clock, and power limit indicators. A hotspot rise paired with clock drops is a common throttling pattern.
Is it safe to run CPU and GPU stress tests at the same time?
Do it only after CPU-only and GPU-only are stable, and stop immediately on black screens, shutdowns, or burning smells. Combined loads are useful for PSU/case airflow validation but can complicate diagnosis.
My results change between runs-what's the fastest fix?
Normalize variables: same fan curve, same ambient conditions, same background apps, and the same test scene/settings. If variability persists, reduce the overclock/undervolt margin and retest.